By Mark Finley
Fellow in Energy and Global Oil
The 2022 edition of the bp Statistical Review of World Energy was recently published (the 71st annual edition), which means it’s time for my annual commentary. (And time for my annual disclosure: I led the production of the Review for a dozen years before joining the Baker Institute, and remain a bp shareholder.)
The Review contains comprehensive, objective global data on every energy form as well as key minerals needed for the energy transition.[1] This note will barely scratch the surface of the fascinating insights contained in the Review, so please have a look at its data (freely available for download) to explore the world of energy for yourself!
One huge caveat: The Review contains annual data through 2021, and so it does not allow us to assess the energy impact of Russia’s invasion of Ukraine in February of this year – except to the degree that pre-invasion preparations affected markets last year, especially for natural gas.
On one level, the Review’s findings are not surprising. After record declines in global energy consumption and production in 2020 due to COVID, 2021 saw a strong recovery. Indeed, the world saw record growth in global energy consumption (+5.8%); energy production growth was also robust (+4.2%, the strongest since 2010, though short of the record growth of 5.4% seen in 2004).
Consumption and production of all energy forms but hydroelectricity grew faster than their 10-year average (with hydro constrained by poor rainfall in many regions). While (non-hydro) renewables were once again the fastest-growing energy source (+15%), consumption of coal and oil were especially strong relative to their 10-year averages (since oil and coal saw the biggest consumption declines in 2020).
With the rapid growth of fossil fuels consumption, CO2 emissions from energy consumption also saw a record increase, growing by 5.9% (compared with a 10-year average growth of just 0.6%).
China remained by far the world’s biggest consumer and producer of energy, and saw the biggest (absolute) increases of both consumption and production for any country. Even though China was one of the rare countries that did NOT see energy consumption decline in 2020, it experienced growth last year that was more than double its 10-year historical average. China accounted for a quarter of global energy consumption last year, and just over 20% of energy production—yet it was responsible for roughly a third of the growth in global energy consumption and production last year. It had the largest growth in consumption of oil, coal, nuclear energy and renewables (and the second-largest growth of natural gas use behind Russia). It also accounted for half of the global growth in coal production.
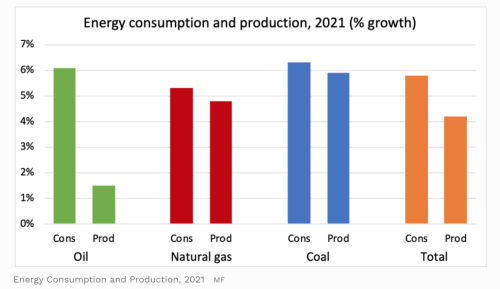
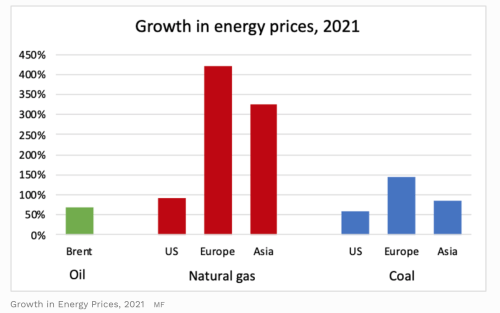
For all forms of fossil energy, consumption grew more rapidly than production. Global inventories declined. And not surprisingly, prices for all forms of fossil energy increased in 2021.
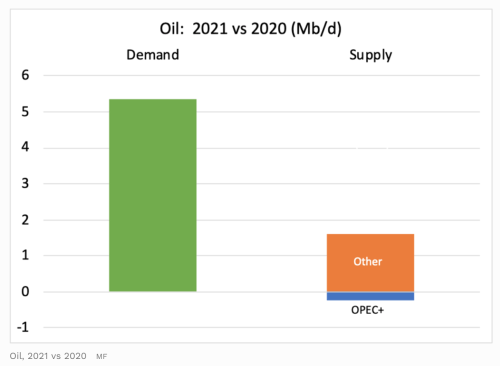
The real outlier for the mis-match between consumption and production was oil: Consumption grew by a very strong 6.1% (the strongest in percentage terms since 1976), while production grew by a tepid 1.5%. The relative weakness of oil production was primarily driven by ongoing OPEC+ production restraint. After falling sharply in 2020 (-3.9 Mb/d) due to the largest coordinated production cuts in history, OPEC+ production fell again in 2021 (-0.2 Mb/d) as the group very slowly unwound its previous production cuts (helped by a number of participating countries that were unable to meet their production quotas). Production elsewhere (including the US) increased by 1.6 Mb/d as investment recovered along with oil prices.
This was also evident in the relatively weak recovery in global oil trade. While strong growth of global consumption and production caused trade in natural gas and coal to grow by double (or even triple) the historical average, oil trade increased by roughly 3%, only slightly above the 10-year average (roughly 2%).
Indeed, global energy consumption in 2021 was above pre-pandemic levels of supply and demand for all forms of energy—except for oil and nuclear power (which remained 1% below pre-pandemic levels). For oil, global consumption last year was about 3.5 Mb/d (-3.7%) below pre-pandemic levels, largely due to the slow recovery of air travel; bp notes that demand for aviation fuel remained 33% below the 2019 level.
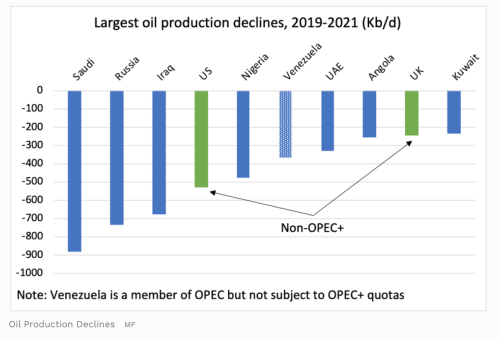
But global oil production has been even weaker, with 2021 output remaining a massive 5 Mb/d below pre-pandemic levels – and here, the driver was government choice rather than pandemic. The OPEC+ countries accounted for the heavy majority (82%) of that decline; output in those countries last year remained 4.1 Mb/d or 9% below pre-pandemic levels.

Indeed, seven of the ten countries with the largest production declines over this period were participants in the OPEC+ production cuts, with Saudi Arabia and Russia – the group’s leaders as well as the two largest OPEC+ producers – accounting for the largest declines.
The interplay of market forces and political choices that the bp data shows for 2021 is clearly at play in global energy markets this year as well. So far this year, the OPEC+ group has carried on with its gradual reversal of the COVID-related production cuts implemented in 2020; in September, the group will have fully restored quotas to pre-pandemic levels. Yet many countries remain unable to meet their quotas, and risks to Russian supplies (of oil and natural gas) have remained in focus as the EU seeks to reduce its dependence. A growing focus on energy security (as well as higher prices) is boosting coal consumption as well as renewables. How will this impact the ongoing recovery in global energy supply? And what does it mean for prices and demand? The answers – as always – will be found in the data.
[1] One item that the Review does NOT contain is global energy production; it has data on total energy consumption, and production of every individual form of energy, but it does not aggregate the fuel-by-fuel production data into a total energy production table. As I explained in previous years’ commentary, however, a simplifying assumption allows me to build my own total energy production table for this commentary.
This post originally appeared in the Forbes blog on August 23, 2022.